
MP4 | Video: h264, 1280x720 | Audio: AAC, 44.1 KHz, 2 ChGenre: eLearning | Language: English | Duration: 72 lectures (7h 26m) | Size: 2.3 GB
Learn about advanced graphing techniques and how to generate these in Stata
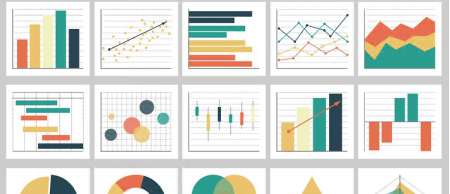
Data visualisation
Graphing in Stata
Basic plot types
Intermediate plot types
Advanced plot types
Distribution plots
Relationship plots
Categorical plots
Specialised plots
Stata code
Advanced Stata code
Basic Stata knowledge
Basic Stata coding (.
do files, commands, varlists and options)
Make sure to check out my twitter feed for promo codes and other updates (easystats3)
Learning and applying new visual techniques can often be a daunting experience. This is especially true if you need to generate and code data visualizations yourself.
This course is designed to provide you with a compact, and easy to understand, set of videos that focus on the basic principles behind many common data visualization and how you can code them in Stata.
The course is modular; just click on the graphs that you are most interested in and learn away. You do not need to follow this course linearly.
This course will teach you many different methods to visualize data and how to generate these yourself in Stata
Visualizing and graphing data is a vital in modern data analytics. Whether you are a data scientist, student of quantitative methods or a business user, having an understanding of how to visualise data is an important aspect in getting data information across to other stakeholders. Many different ways of visualising data have been devised and some are better than other. However, each method has advantages and disadvantages and having a solid understanding of what visualization might be best suited is key to delivering a concise and sharp "data message".
Often, it takes years of experience to accumulate knowledge of the different graphs and plots. In these videos, I will outline some of the most important data visualization methods and explain, without any equations or complex statistics, what are the advantages and disadvantages of each technique.
I will also demonstrate how each graph can be created, modified and customised in Stata.
The main learning outcomes are:
To learn and understand the basic methods of data visualization
To learn, in an easy manner, variations and customisations of basic visualization methods
To gain experience of different data visualization techniques and how to apply them
To learn and code many Stata graphs
To gain confidence in your ability to modify and create bespoke data visualisations in Stata
Please note the following: You should have some understanding of how Stata works and what .do files are. If you are totally new to Stata you should take a look at my "Essential Guide To Stata" course that explains Stata from the ground up. This course focuses specifically on how to create many different types of graphs and all their possible options and sub-options.
Specific themes include:
Histograms
Density plots
Spike plots
Rootograms
Box plots
Violin plots
Stem-and-Leaf plots
Quantile plots
Bar graphs
Pie charts
Dot charts
Radar plots
Scatter plots
Heat plots
Hex plots
Sunflower plots
Lines of best fit
Area plots
Line plots
Range plots
Rainbow plots
Jitter plots
Table plots
Baloon plots
Mosaic plots
and more
Stata users
Data analysts
Data scientists
Quantitative degree students
Quantitative business users
Economists, Social Scientists, Political Scientists, Biostatisticians, and other disciplines
DOWNLOAD
uploadgig.com
https://uploadgig.com/file/download/58D56e65039732cF/Data_Visualization_i.part1.rar
https://uploadgig.com/file/download/15696582978f0ef0/Data_Visualization_i.part2.rar
https://uploadgig.com/file/download/49AC757c159D4ad2/Data_Visualization_i.part3.rar
rapidgator.net
https://rapidgator.net/file/b8876e0d134677c68ee48ebdd6e11c3e/Data_Visualization_i.part1.rar.html
https://rapidgator.net/file/99d52b7874282feec37599b5830decb9/Data_Visualization_i.part2.rar.html
https://rapidgator.net/file/05d6e55fef67e5e492d135255c9ba2bb/Data_Visualization_i.part3.rar.html
nitro.download
https://nitro.download/view/05E1618E668B861/Data_Visualization_i.part1.rar
https://nitro.download/view/B70BE57740EE528/Data_Visualization_i.part2.rar
https://nitro.download/view/5818DF8354C0B04/Data_Visualization_i.part3.rar
